

Analyzing data: The “meaning-making” process
Data analysis is the process of generating insights from data you’ve collected based on the Learning Questions developed during the measurement planning process.
Ideally, you will have different types of data for each learning question (i.e., a mix of quantitative and qualitative data) so you can cross-check (or "triangulate") results across data sources. For instance, if the answers to a survey question demonstrate that youth overwhelmingly rate the program positively, you can cross-check this finding with interview or focus group results to see if those results reinforce or contradict the survey ratings, as well as to dig deeper into questions of why this was the case.

Photo credit: Student Conservation Association
Developing a Data Analysis Plan
and Reflection Questions
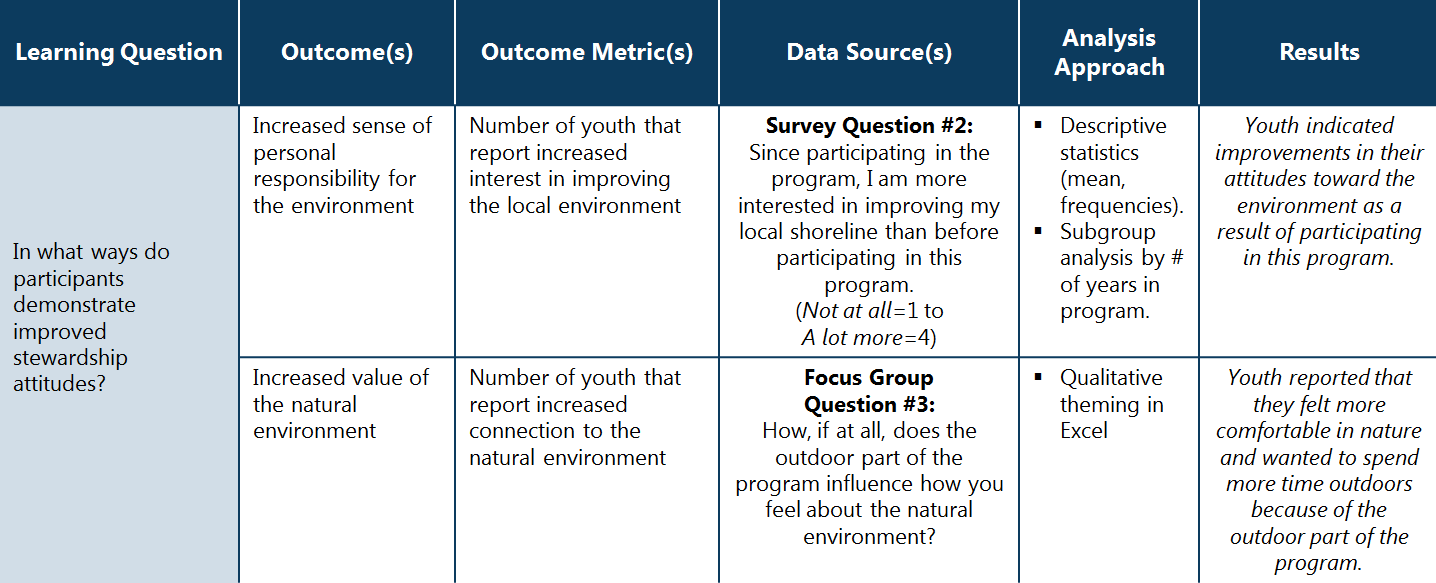
The sample Analysis Plan below shows how to map out your data analysis based on your Learning Questions.
Being open and self-reflective is essential to developing a nuanced and accurate understanding of your findings. Your job in the analysis process is not only technical – crunching numbers and finding themes – but also adaptive and developmental. You have to be open to unpacking and challenging your beliefs, assumptions, and potential biases regarding what you had hoped would be the results going into the evaluation process.
Self-reflection questions to strengthen the process of data analysis
- What results surprised you? Why?
- Looking back at your Theory of Change, what were your assumptions going into the process? Did you find any results that may contradict those assumptions?
- What do you notice about how you tend to interpret data? Do you tend to be an “easy grader” or a “hard grader” when it comes to drawing conclusions about what you are seeing?
- What are your “blind spots”? Are there things you tend to overlook or not take into account as readily?
- What biases might you exhibit from time to time? What personal experiences might underlie these biases?
- What are potential ways to mitigate your biases? Are there others you can reach out to for support? If there are biases you cannot mitigate, can you exclude yourself from the related parts of data analysis?
- Who/what else contributed to the outcomes observed? Think about contextualizing “big claims” within a youth’s larger landscape, instead of framing your program as a single contributor.
- What voices or perspectives are most at risk of being overlooked? What steps can you take to ensure they’re included?
- What responses, if any, are outliers and do not map onto the general trend? Why do you think these data may differ?
- Looking back at your Theory of Change, what were your assumptions going into the process? Did you find any results that may contradict those assumptions?
Getting started: the basics of analysis
Descriptive statistics are basic summaries – numbers and percentages – of the data you’ve collected. Looking at descriptive statistics is the first step in analyzing any quantitative data on target population, program participation, and outcomes. Start the analysis process by looking at frequencies (numbers and percentages) for each data element (such as race/ethinicy or gender) and means (aka averages, for things like age).
For our examples, we will be using analysis generated by the low-cost online tool SurveyMonkey. You also can use other online tools to generate your analysis. Excel PivotTables also can be used (there are many excellent tutorials online), but often require multiple steps to prepare your data for analysis.
For our examples, we will be using analysis generated by the low-cost online tool SurveyMonkey. You also can use other online tools to generate your analysis. Excel PivotTables also can be used (there are many excellent tutorials online), but often require multiple steps to prepare your data for analysis.