

Exploring Outcome Data
Look at outcome data – changes in the target population that you aim to achieve – to understand the extent to which participants have experienced shifts in relationships, knowledge, awareness, capabilities, attitudes, and/or behaviors as a result of your program.
- What do you notice about the frequencies – numbers and percentages – of response to different questions and experiences of outcomes?
- Note where there are 3 to 5% percentage point differences, 5 to 10% percentage point differences, etc. across questions/outcomes as a starting point to explore where meaningful differences might lie.
- How do the results compare to your expectations going into the analysis process?
- Note where there are findings that are lower and higher than you had expected. Discuss why you think this might be the case.
- Be open to surprises. You can and should question the data, but also be open to learning where results are less than hoped for. This is where the opportunities for learning to improve performance live!
- What limitations in the data still exist that might affect your interpretation of the results?
- Refer back to our summary of possible strengths and limitations.
- Note where there are 3 to 5% percentage point differences, 5 to 10% percentage point differences, etc. across questions/outcomes as a starting point to explore where meaningful differences might lie.
We address how to relate outcomes data to target population and program participation data below.
Example of Outcome Data
Here is a sample data table that SurveyMonkey generates with descriptive statistics:
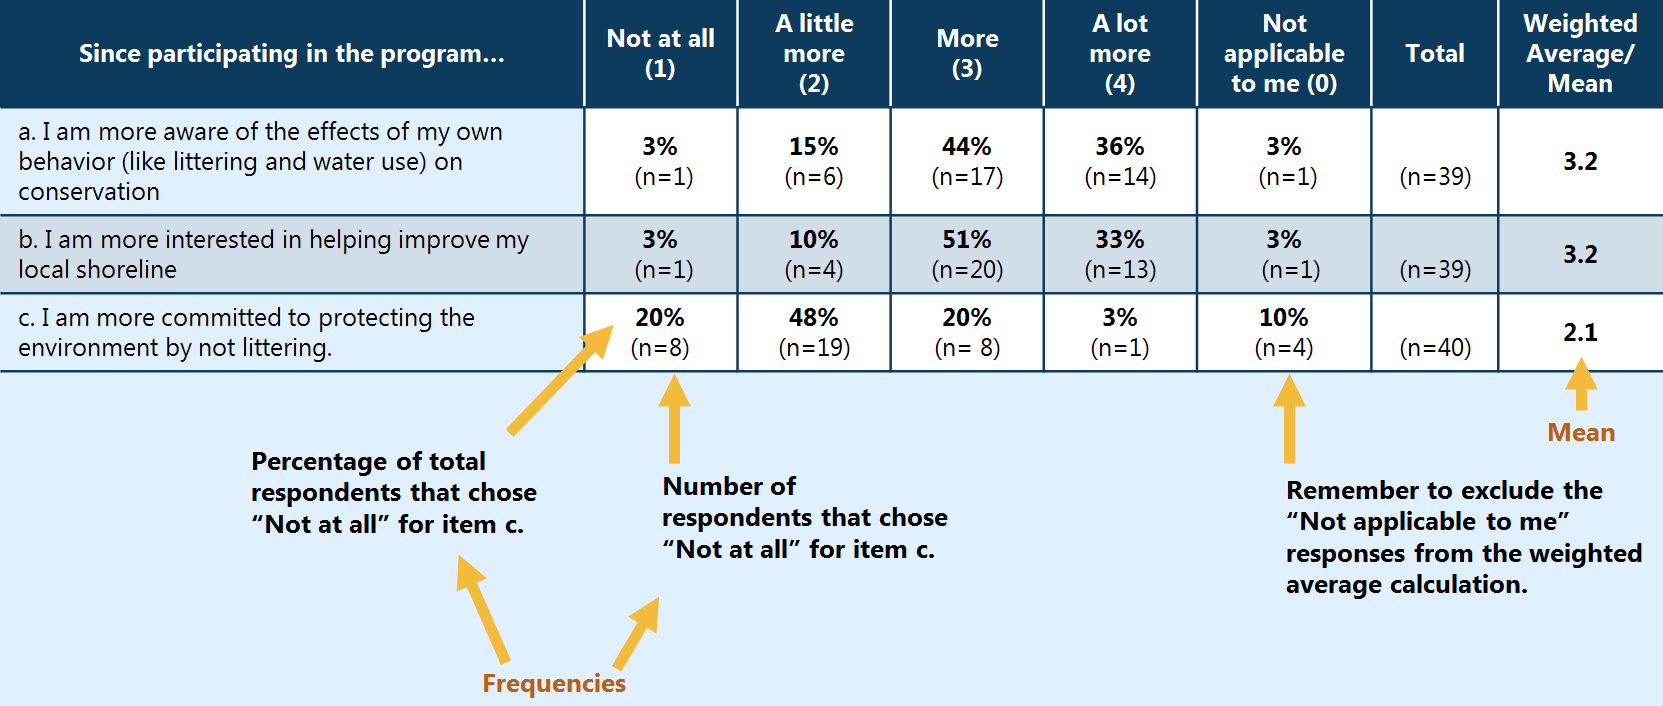
Basic Analysis:
Understanding frequencies and means
- Frequencies tell us how results are distributed across a possible set of values – you can look at minimum and maximum values and where the data cluster(s).
- Distributions, which depict the way in which responses are spread out over different response options, are sometimes depicted by percentages to provide an at-a-glance breakdown of the proportion of participants that fall within each response option.
- Frequencies can be useful for understanding the proportion of a population that achieved a desired change (for example, you may want to say X% of a population selected “Agree” or “Strongly Agree”).
- Distributions, which depict the way in which responses are spread out over different response options, are sometimes depicted by percentages to provide an at-a-glance breakdown of the proportion of participants that fall within each response option.
- Means tell us where a group is on average and describes the “central tendency” of the data – i.e., where most results tend to be.
- Be careful not to take the mean as representative of every group member’s opinion or experience.
- Means are particularly interesting and useful when comparing a range of different outcome metrics across different sub-groups of participants.
- Be careful not to take the mean as representative of every group member’s opinion or experience.